Tuesday, June 29, 2010

You can't overdose on vitamin D through sunlight

Her skin might be like leather and disturbingly wrinkled but she isn't o'ding on vitamin D.  

Vitamins are incredibly safe compared to drugs. It always amuses me when medical people get upset about people having a higher vitamin intake than the RDI. This is because water soluble vitamins are almost impossible to overdose on, unlike most drugs where if you take significantly more than the dose you can end up seriously ill. The fat soluble vitamins it is possible to have a to higher intake. This is because fat soluble vitamins accumulate into the body tissues and organs. The irony is that for vitamin A, a fat soluble vitamin nearly all overdoses are caused by doctors! That is right doctors subscribe vitamin A for some conditions. The patients took more than they should of or where not informed properly from the doctors. Health food products don't have enough vitamin A in them to cause overdose unless you deliberately took handfuls of them. Most health products have a little vitamin A and a lot of caroteneoids This means the body can decide how much vitamin A to make from the carotenoids, thus almost eliminating the risk of vitamin A overdose.

Anyway back to the vitamin D. As we know vitamin D is made in the skin when exposed to sunlight (UV rays). It hadn't occurred to me until know that if you lived out in the sun, say like a lifeguard, you might be exposed to so much sun that you get an overdose of vitamin D. Well it turns up, rather unsurprisingly, that once the body has produced enough vitamin D it  is no longer produced, or is produced at a lot lower rate. This is because to make vitamin D the body has to first produce a precursor to vitamin D. That is the body produces a molecule that the UV light modifies into vitamin D. Don't make the precursor you don't get the vitamin. Also tanning also reduces vitamin D production, so can be seen as another way the body limits vitamin D production.  

Thus you can't overdose on vitamin D through sunlight exposure.

Sunday, June 27, 2010

How the vitamin D RDI was set.

I'm unsure if I covered this specific information in my book...... however it is important enough to repeat even if I did. The first blood measurement of vitamin D, which is the chemical 25-hydroxycholecalciferol (25(OH)D3, was undertaken in 1971.

They studied 40 "healthy" volunteers of mean age of 30 years old. The volunteers didn't have any clear clinical signs of vitamin D deficiency. That is they didn't have osteomalacia which is like osteoporosis but occurs in younger people. It was determined that the 40 volunteers had a (25(OH)D3, level of  68 nmol, and their dietary intake was 318 IU per day. Thus the RDI of 400 IU for an adult was set. It was set higher than 318 IU most likely to make sure that the population who were poor vitamin D absorbers would still obtain a blood level of 68 nmol. On the other had it could have also been set at 400 IU to make sure that people got 318 IU, that is if people aimed to get 318, they might say only get 250 IU, where as aiming for 400 IU and obtaining 250 IU would be acceptable.


Friday, June 25, 2010

Vitamin D measurment in your own blood

As I mentioned yesterday I look forward to the day when you can measure your own vitamin D levels. Well found on the web such a device. It just costs US$65+P&P. Then I looked up a medlab testing handbook that I down loaded a few years ago. Turns out that they could measure vitamin D levels. Don't know if pathlab does this but would assume so.... so would be interested in finding anyone who has had this tested. 

Thursday, June 24, 2010

Just to let you know the variation in human studies

When a doctor or medical person talks to you and recommends something it sounds like they know what they are talking about. This is because they have come to understand was is "normal" variation. When I stated to discover how big this variation was I was very concerned. This is because I was used to creating sensors that were very accurate. The correlation between cause and effect is very different between machines and biological systems.

Let me give you an example. You know that vitamin D is important in bone formation and the higher the vitamin D the more calcium is absorbed. This would be considered a basic fact. Well let you show a graph that shows this correlation:

When I was in research we would have called this a shot gun plot. It is the shape that a shot gun creates when you fire it therefore there is no correlation. However because human studies have such higher variation this is considered a correlation.

This is very problematic. Because the level of calcium absorption is so variable, you can't tell the individual what they need to be taking. This is because if you look at the graph some people have the same calcium absorption at 20 mmmol/l level, while others have it at the 120 mmol./l. I look forward to the day when tests are common enough and cheap enough that we can all have our blood levels measured and our supplementation tailored to our needs.

Wednesday, June 23, 2010

What level of vitamin D is optimal ?

One of the issues with vitamin D is the wide range of vitamin manufacture. If you expose you whole body to the sun you can generate 20 000 IU of vitamin D in 10-15 minutes. This is a lot considering that the the adult RDI is only 200-600 IU a day.

There is also discussion about what consitutes a healthy level of vitamin D.Vitamin D in blood is technically called 25-hydroxyvitamin D or in short hand it is written as (25[OH]D). Clinical deficiency signs start to be apparent at levels <20 mmol/l. There is debate about what is an optima level, for example some would say <40 well others <80 mmol/l, still others say <125 mmol/l. So as you can see there is not yet a consensus around what the optima level is.

We a NZ study that I reviewed a few weeks ago took a <50 mmol/l as being inadequate in children.  It was this level that 80% of children / toddler were deficient. Given that <50 mmol/l appears to be a more conservative cut-off things could be worse than the study showed.

This makes me very grateful that where I do most of my work I get direct afternoon sun in winter!

PS sorry about the blogging sabbatical. Had some "issues" with the kids school that sucked the emotion out of me. Thus rendering my brain foggy, good news is that it has all worked out and things are better than before. So bewarned expect more posts ! 

Monday, June 14, 2010

The power of a lobby group

Rob Jackson writes in the NZ herald about how drinking red wine (or alcohol in general) doesn't give health benefits. In doing so he hits the nail on the head - without a strong proactive lobby group you, the public, don't get to hear about the research.

Hence much life changing research goes un noticed by the public..... and hence why I blog.... to try and make a small difference (or big) in peoples lives.

Lower temperature and higher humidity helps preserve vitamin C

One of the ways we enjoy preserve fruit is to dehydrate it. This takes out the moisture and thus concentrates up the sugars. Yum. A study looked at vitamin C levels in kiwifruit with different drying conditions.

The lower the temperature the most vitamin C was preserved. This makes sense as vitamin C is a heat sensitive vitamin. The temperatures used were 35, 45, 55 and 65 °C. at 35 degrees I would have thought that the drying would have taken so long that more vitamin C would have been lost. However this doesn't seem the reality. I will have to get another dehydrator cause ours doesn't have a temperature control and must be quite hot as it dehydrates fast.

The other discovery was that the higher the humidity the more vitamin C is preserved. I find this very interesting as I can't explain why this would be. I will however put a saucer of water in the dehydrator after a while as the humidity starts to drop as the fruit becomes drier. 

Reference.

Christchurch people should be supplementing

In yet another vitamin D paper looking at Christchurch personal. It states:
25(OH)D levels were <75 nmol/L in 88% of subjects in February 2004 and in 100% of subjects in June and July.
Now 25(OH)D is the fancy name for your blood vitamin D levels. There is discussion around what level is optimal. In this case the paper writers believe above 75 is the optimal level. However only 12% were hitting this level in summer and none in winter. So in conclusion they state:
The authors suggest that a daily supplement of 2600 IU vitamin D3 would correct vitamin D deficiency.  
So I assume that if you live in the Christchurch area when you last visited your GP (s)he told you to go out and get some vitamin D supplements..... no.... rely....... maybe the research is so new that you haven't been to your GP since the work was done. Well it was published in 2007 so me thinks you have been to the GP since then. And people believe that doctors and medical people are up with the play..... wake up folks !


Source: N Z Med J. 2007;120(1262): U2733  h t t p : / / w w w . n zma . o r g . n z / j o u r n a l / 1 2 0 -
1262/2733/via Maori Health Research Review Issue 9

Saturday, June 12, 2010

1999 Study: Elderly Aucklanders need to supplement with vitamin D

It makes me very angry how little potentially life changing research isn't communicated to the general public. A 1999 study investigated the vitamin D levels in elderly women in aged care. This was their findings:
The prevalence of frank hypovitaminosis (<10 μg/L) was found to be 49% in midwinter and 33% in midsummer.
We are not talking about optimal levels here, we are talking about clinical deficiency. If these levels were present in children they would be highly likely they were developing rickets. We all love our elderly (although sometimes frustrated by them!) and want to provide for them. Part of this care should be supplying them with vitamin D supplements - cause they need it - and we should have started been doing this over a decade ago !

We can either place elderly into the sun with arms and legs exposed for 15 - 30 mins a day (outside of the burn time in summer) or supply them with a high level multivitamin (they often don't eat enough to get even the RDI of vitamins and minerals).

Reference: Sarah J Ley, Caroline C Horwath, Joanna M Stewart. Attention is needed to the high prevalence of vitamin D deficiency in our older population. NZ medical Journal 

Tuesday, June 8, 2010

Take some vitamin D and ward of the flu

Came across this graph in a review on flu vaccinations. Now I haven't read the review - so can't comment on it. However it had this very interesting graph. Supplementing at 800 IU significantly (massively?!) reduced the risk of catching the flu. After my earlier post about 800IU I might go get some extra vitamin D as my supplement only has about 400IU.  

Sunday, June 6, 2010

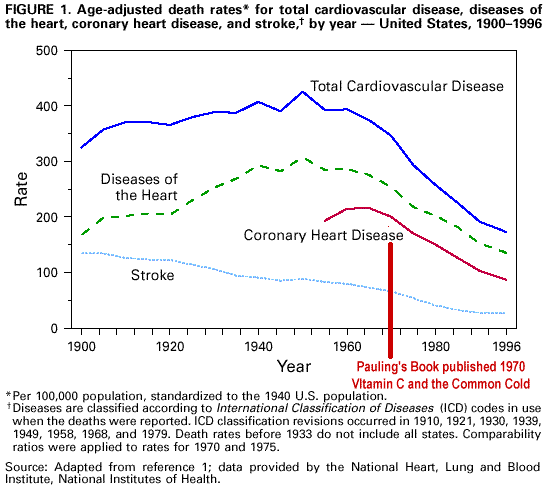
Has vitamin C reduced heart disease deaths since the 70's?

Found the figure below very interesting and unsure what to think about it. Found it on the Vitamin C Foundations website. So clearly they are not impartial (and no one really is). I don't know if other factors have also  impacted the mortality rate... so until I know more I'm not going to say this graph is correct, however it is interesting enough to post. I have a copy of Pauling's book (he was the guy who got the Nobel price for determining the chemical structure of vitamin C ) and can't say I was impressed by it. However apparently vitamin C sales increased (not unsurprisingly) at this point.
   

Asc


sd

Friday, June 4, 2010

Optimal vitamin D level different for various individuals

One of thee frustrating things is that RDI's and my book about optimal vitamin intake all focus on population statistics or averages. That is what is the level that is best for most people, not what is best for you. Technology is moving in this direction to allow people to optimize their own vitamin levels. May this happen with haste....

A just out paper looked at supplementing 800IU of vitamin D(3) in the Southern USA. Initially over 85% had sub optimal levels of vitamin D (hence why people need to supplement). However after 6 months of supplementing every day with 800IU, only half of the people had optimal levels of vitamin D.
This dramatically shows how some people need more vitamin's than others.

To put these numbers into perspective I recommend in my book that people obtain 400IU of vitamin D a day. So they are supplementing at twice the level I recommend, yet half of the population was still not obtaining optimal status with 800IU a day........

Reference: Marjorie L McCullough, ScD, RD, Roberd M Bostick, MD, MPH, Carrie R Daniel, PhD, MPH, W. Dana Flanders, MD, MPH, Aasma Shaukat, MD, MPH, Jill Davison, MPH, Udaya Rangaswamy, BS and Bruce W Hollis, MD Vitamin D Status and Impact of Vitamin D3 and/or Calcium Supplementation in a Randomized Pilot Study in the Southeastern United States. Journal of the American College of Nutrition, Vol. 28, No. 6, 678-686 (2009)

Tuesday, June 1, 2010

POP part 3: Increasing poison with age, Auckland & Waikato worse, NZ overall still better

Continuing on the series about persistent organic pollutants POP's. First is the figure of blood levels of POP's by region in NZ. There are two points to note. Firstly that the blood level rises over time. This is due to a somewhat constant exposure, but due to the body taking 7 - 10 years to remove a POP, it means that we are exposed to POP's faster than we can remove them. The other disturbing piece of information is that Waikato area and Auckland area are higher than rest of the country. Auckland region is likely to be higher because of air pollution and more contaminates being found in the soil which migrates into the food chain. Waikato is a bit surprising as it is a largely agricultural area. Therefore I would hypothesize that it is due to the sprays that have been used, and continue to be used in the agriculture. In the USA it was found that counter intuitively that kids in rural communities were more likely to get cancer than in the city, again the researches thought this was due to the chemicals used in agriculture.   


However this might not be the case.... the following graph is for DDT metabolites in the blood. DDT has been banded for decades, however it hangs around in the environment for a long time.Waikato and Auckland have low levels, while South Island and the lower part of the North Island have higher levels, even in the lower age groups. I wonder if sheep farming used DDT more than other agricultural uses? Or is it due to other soil residues...


Lastly breaking down the data into ethnicity and sex there is a clear sex bias with males having higher levels than females. The two tall graphs in 50-64 age bracket have very low number of people, 5 and 7 respectively. Therefore these are not particularity indicative of the whole population. So even in the 15-24 group males have higher levels than females. PCB congeners is the technical name for PCB chemicals.

Various PCB's were banned in 1989 and total ban in 1994. Disturbingly PCB's can easily migrate through skin and through latex rubber gloves. Furthermore they are present in a number of situations were I personally could have been contaminated! This includes:
This list is only the ones that I could have been exposed to. Given that I am a "hands on" type of guy, who took his first bit of electronics apart when I was about 6, in 1982 I could have had over a decade of exposure without knowing it! Given that NZ's in general like to "muck in" and historically (and maybe even still) boys like to much in more than girls, hence the sex difference.


Given my exposure might be high..... makes me wonder where I can get my blood tested !

Ending on a positive note..... NZ compared to other countries continue to have low concentration. For instance the graph below compares our PCDD's to international levels. We are definitely in the low end and this was the case for all POP's measured in NZ'ers blood. So I guess I can rest a bit easier cause in general my exposure is lower than other countries.

Reference: Concentrations of selected organochlorines in the serum of the non-occupationally exposed New Zealand population Organochlorines Programme. Ministry for the Environment. May 2001