I assume that you have heard of GI as "LOW GI" is splashed across various cereal products. I had not really understood anything about GI expect that low GI was good and high GI was sugar.
So lets discover what the glycemic index really is and how it came about.
In the 70's it was proposed that different carbohydrates would result in different blood sugar / blood insulin levels. This was found to be true and the GI concept was first proposed in 1981. Yes that is right folks it has taken nearly 30 years from proposing GI to it becoming knowledge to the public.
GI is a percentage from 1 - 100 %. So a GI of 1 would be the lowest and 100 the highest. Being a percentage it must compare the test food against a "standard" food. So it compares the rise of blood sugar levels, which is glucose, against the test food. The standard food is the food that gives the largest area under the glucose blood level graph.
First surprise is that the standard food is actually maltose and not white sugar (sucrose). I had to look up maltose and it is a sugar which is made up of two glucose molecules. So it is no surprise that maltose causes a rapid increase in blood sugars as glucose is the sugar that powers your body. (It is (glucose 6-phosphate for you techy's).
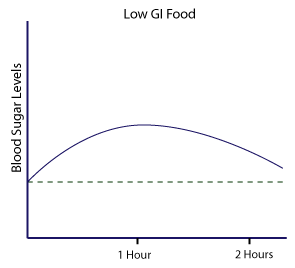
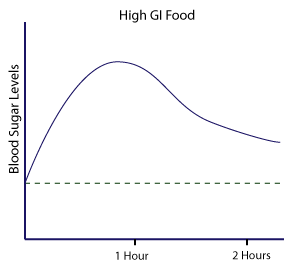
Now if you go read a pamphlet or talk to a health professional they will show you these types of graphs. It is clear what the difference between the to foods are. One causes little rise and is soon back to normal while the high GI causes a big and sustained increase.
Source for graphs
Now because every ones body is different to be perfectly accurate you would have to eat 50 grams of maltose and have your blood sugar levels monitored. Then you would have to eat 50 grams of the test subject. This issue is quietly ignored because it would be to difficult to undertaken this kind of testing for everyone. However it raises the issue that a high GI food might cause a much bigger increase in the blood sugar levels than for another person. There could well be a genetic component that changes how blood levels rise and fall.
The above issue aside there is a very important issue. This issue is that blood sugars actually go negative. Have a look at this original data, again click to enlarge (the legend is also written by me under the graph)
The graph shows the rise in blood glucose and blood insulin for three different carbohydrates.The are mung bean starch (square solid) maize starch (triangles) and glucose (circles). You an see that the mung bean starch causes much smaller rise in blood sugars and does not go negative, thus it would have a low GI. However both the glucose and maize starch sometime between 90 and 120 minutes crosses through into negative before slowly rising back towards zero but still not positive after 4 hours!
This is very different behavior than the stylized graphs above. Mathematically the area under the graph for the stylized graph and the real data could be the same (area under curve is integrated to give the number). However having your blood sugars drop negatively after a food is a very concerning concept.
So in summary GI is a percentage of blood sugar rise compared to maltose, which is two glucose moleculars. The blood sugars go negative. The next post will uncover various GI's and how they compare.
Reference: S. W. Rizkalla, F. Bellisle and G. Slama Health benefits of low glycaemic index foods, such as pulses, in diabetic patients and healthy individuals British Journal of Nutrition, Volume 88, Supplement S3, December 2002, pp 255-262


No comments:
Post a Comment